ReportingThe report needs to be geared towards its potential readership. The types of information required by government ministry officials, by other stakeholders, by researchers or farmers are different. Whilst series of tables may be important for agricultural development officers and researchers, they will also need to be provided with graphical presentations of the results, as just shown, to indicate overall trends. Some documentation will also be required to indicate the important, and, where appropriate, the statistically significant results. Care must be taken in ensuring that inferences are made only when the results are obvious or can be qualified statistically. |
||
|
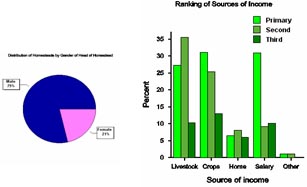
Farmers are at the other end of the spectrum. They need simple presentations of the results in a pictorial form (such as many of the graphical representations shown in this case study) that they can clearly understand. They and other organisations involved in the execution of the survey are often neglected. Feed back to them is important and is often not done. Pie charts and bar charts are a particularly useful method of presentation. Case Study 7 discusses a different method of reporting back to farmers. |
 |
|
![]()
![]()
![]()